Beyond the 10% Threshold: The Psychology, History, and Real-World Impact of
The 10% stock market correction is more than a technical benchmark; it's

Beyond the 10% Threshold: The Psychology, History, and Real-World Impact of Stock Market Corrections
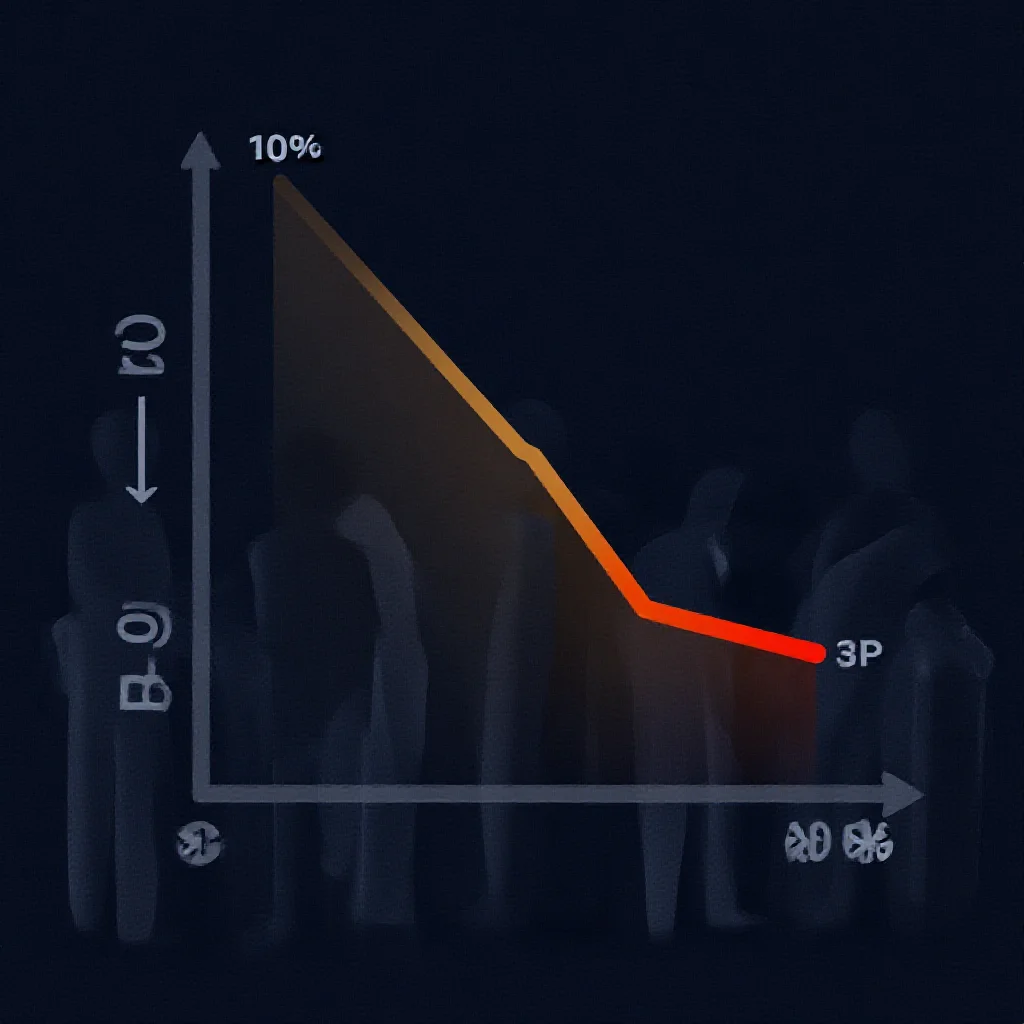
A stock market correction is technically defined as a decline of 10% or more from a recent peak. This benchmark, while arbitrary, serves as a critical psychological trigger and a recurring feature of modern financial markets. The S&P 500’s decline of over 10% from its January 2022 peak by April 2022 exemplified this phenomenon, entering the widely recognized correction territory. (Source 1: [Primary Data]) The significance of this threshold extends beyond a mere technicality, functioning as a market stress test and a behavioral event that reveals underlying vulnerabilities in market structure and sentiment.
The Arbitrary Anchor: Why 10%?
The adoption of the 10% threshold is a market convention without a precise economic foundation. Its power derives from the psychological weight of round numbers within financial discourse and behavioral economics. Analysts and media outlets utilize this clean, easily communicated figure to categorize market downturns, creating a shared vocabulary for volatility. This technical definition, however, often diverges from its subjective impact. The declaration of a "correction" can shift market participant behavior, potentially amplifying selling pressure as the threshold is approached or breached. The contrast between the objective 10% decline and its role as a self-fulfilling psychological trigger forms the core of its market significance.
A Historical Rhythm: Corrections as a Market Constant
Historical data validates the correction not as an anomaly but as a standard rhythm of equity markets. Analysis of the S&P 500 since 1980 indicates that a decline of 10% or more from a peak occurs, on average, approximately every two years. (Source 2: [Historical Market Data]) The April 2022 event was, therefore, a manifestation of this long-term statistical pattern rather than a unique crisis. This regularity positions corrections as inherent mechanisms for price discovery and the release of excess optimism. A timeline of the S&P 500 over this period, marked with these periodic declines, visually underscores their frequency and the market’s consistent recovery trajectory, framing them as predictable interludes within secular bull markets.
Triggers vs. Symptoms: What Really Drives a 10% Drop?
The proximate causes of a correction are varied and widely reported. Catalysts can include unexpected inflation data, geopolitical conflicts such as the Ukraine war, or pivotal shifts in Federal Reserve monetary policy, as witnessed in 2022. However, these triggers often function as pretexts. The correction’s primary utility is as a diagnostic tool, revealing pre-existing and less-visible market vulnerabilities. An overextended valuation, excessive leverage in certain sectors, or deteriorating market breadth are typically exposed when a trigger arrives. Consequently, the magnitude and character of the market’s reaction to a given trigger provide more critical information about systemic fragility than the trigger event itself.
The Correction Fallacy: When the 10% Rule Misdirects
A rigid focus on the 10% price threshold carries inherent analytical risks. It can obscure more meaningful distinctions in market health. A rapid, high-volume 10% decline in a fundamentally robust market differs materially from a slow, grinding 10% fall on weakening internals. The practice of "correction watching" can promote reactive, short-term trading decisions that undermine disciplined, long-term investment strategy. Furthermore, alternative metrics may offer superior insight into market stress. These include the percentage of stocks trading below key moving averages (breadth), the widening of corporate bond credit spreads, or the shape of the volatility term structure—indicators that often deteriorate before a broad index reaches the symbolic 10% decline.
Neutral Market Outlook and Analytical Projections
Based on the historical frequency and function of corrections, their recurrence is a high-probability event within any long-term investment horizon. The fixation on the 10% benchmark is likely to persist due to its psychological and communicative utility, despite its technical limitations. Future analytical focus is expected to increasingly integrate the 10% price-level data with deeper structural metrics like breadth and credit conditions to form a more nuanced assessment of market health. The primary forward-looking implication is that corrections will continue to serve as periodic resets, with their ultimate impact—whether a brief pause or a transition into a bear market—determined not by crossing the threshold itself, but by the fundamental economic and earnings landscape that the correction unveils.
(All rights reserved by Global Beacon Chronicle. Unauthorized reproduction is prohibited.)
Wang Jing / Wang Jing
Capital markets analyst and CFA charterholder.