Beyond the Dip: Why Oil & Gas ETFs Defied a Market Sell-Off and What It Reveals
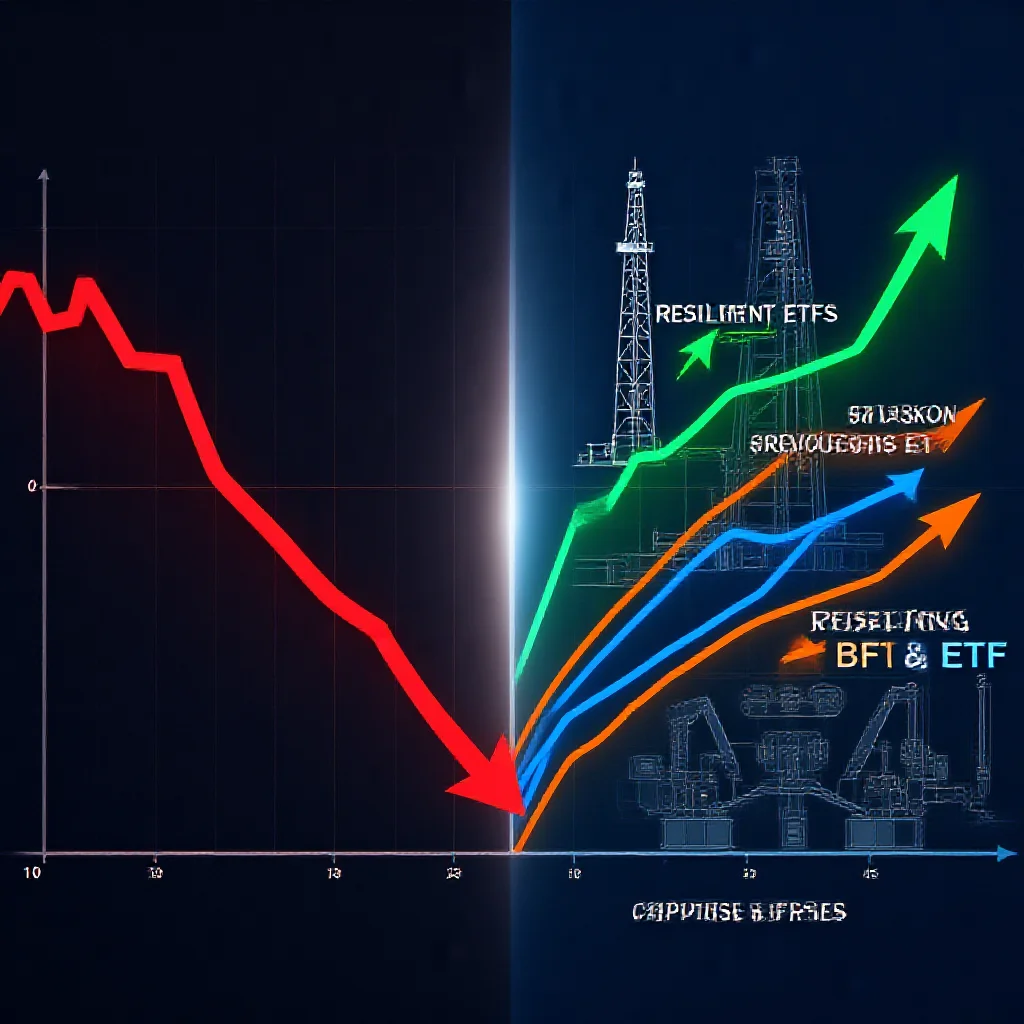
While the broader market sold off, three specific oil and gas ETFs—USO, XOP,

Beyond the Dip: Why Oil & Gas ETFs Defied a Market Sell-Off and What It Reveals
The Anomaly: A Green Island in a Red Sea
A broad-based market sell-off painted major indices in red, reflecting widespread investor risk aversion. Within this environment, a distinct anomaly emerged. Three exchange-traded funds (ETFs) focused on the energy complex—the United States Oil Fund (USO), the SPDR S&P Oil & Gas Exploration & Production ETF (XOP), and the VanEck Oil Services ETF (OIH)—traded in positive territory (Source 1: [Primary Data]). This divergence presents a core analytical question: whether the performance was a coincidental short-term fluctuation or a signal of deeper, structural market forces at play. The simultaneous resilience across three distinct energy vehicles suggests the latter warrants investigation.
Deconstructing the Trio: Three Paths to Energy Exposure
The performance cannot be analyzed uniformly; each ETF represents a unique strategic exposure to the hydrocarbon value chain.
* USO's Direct Play: The United States Oil Fund (USO) is designed to track the daily price movements of West Texas Intermediate (WTI) crude oil, primarily through futures contracts (Source 1: [Primary Data]). Its performance is a near-pure reflection of commodity price dynamics, decoupled from corporate earnings or equity market sentiment. It represents a direct bet on the spot and forward price of the physical commodity.
* XOP's Equity Basket: The SPDR S&P Oil & Gas Exploration & Production ETF (XOP) provides exposure to a portfolio of companies engaged in the exploration and production (E&P) of oil and natural gas (Source 1: [Primary Data]). Its performance is a function of both underlying commodity prices and the operational and financial efficiency of the constituent companies. It offers leveraged exposure to oil prices through corporate earnings.
* OIH's Services Focus: The VanEck Oil Services ETF (OIH) targets companies that provide equipment, services, and drilling for the oil and gas sector (Source 1: [Primary Data]). Its performance is a leading indicator of expected industry capital expenditure (capex). Strength in OIH suggests anticipation of increased upstream activity, as service companies are hired prior to and during production increases.
The Hidden Logic: Decoding the Divergence from the Market
The collective positive performance of these ETFs during a market decline points to several non-exclusive hypotheses grounded in market logic.
- Inflation and Real Assets Hedge: Energy commodities and the equities of firms holding hard asset reserves have historically served as a hedge against inflation. In an environment where a broad market sell-off is driven by fears of persistent inflation and aggressive monetary tightening, capital may rotate toward tangible, revenue-generating assets perceived to retain intrinsic value.
- Geopolitical and Supply Shock Anticipation: The market may be pricing in potential supply disruptions not immediately relevant to broader equity indices. Ongoing geopolitical tensions, structural underinvestment in production capacity, and strategic inventory dynamics can create a bullish outlook for oil prices irrespective of short-term macroeconomic concerns affecting other sectors.
- Sector-Specific Fundamentals: The resilience may reflect strong underlying fundamentals within the energy sector. Disciplined capital expenditure, debt reduction, and shareholder returns have altered the sector's financial profile. Favorable supply-demand dynamics for hydrocarbons can trump transient macro fears, leading to capital allocation based on isolated sectoral strength.
A critical observation is that this was not a uniform rally. The subtle performance differences between USO, XOP, and OIH reveal market preferences and nuanced bets within the energy ecosystem itself.
Beyond the Headline: The Supply Chain Story Told by ETF Performance
The relative performance spread between these three ETFs acts as a narrative tool for interpreting market sentiment toward the energy supply chain.
* If USO significantly outpaces the equity-based ETFs, it suggests a pure commodity bet, with investors seeking exposure to oil price movements while potentially avoiding equity market risk or expressing skepticism about corporate execution.
* If XOP shows relative strength, it indicates confidence that E&P companies will translate higher commodity prices into shareholder value through operational efficiency and capital returns.
* Strength in OIH, particularly alongside XOP, would signal an expectation of rising production activity, as producers increase drilling and completion budgets, directly benefiting service providers.
The long-term implication hinges on the durability of the driving factors. If the cause is a transient flight to safety, the decoupling may be temporary. However, if the divergence is rooted in a fundamental re-assessment of energy security, long-term commodity supply constraints, and a permanent improvement in sector capital discipline, it may signal a structural re-rating of energy assets within global portfolios. The event provides a framework for monitoring whether energy sector performance continues to exhibit a lower correlation to broad market downturns, potentially cementing its role as a distinct allocation for portfolio diversification.
(All rights reserved by Global Beacon Chronicle. Unauthorized reproduction is prohibited.)
Wang Jing / Wang Jing
Capital markets analyst and CFA charterholder.