Global Markets at a Crossroads: U.S. Consumer Strength vs. European Gloom
The week ending April 24, 2026, delivered a sharp divergence in global market

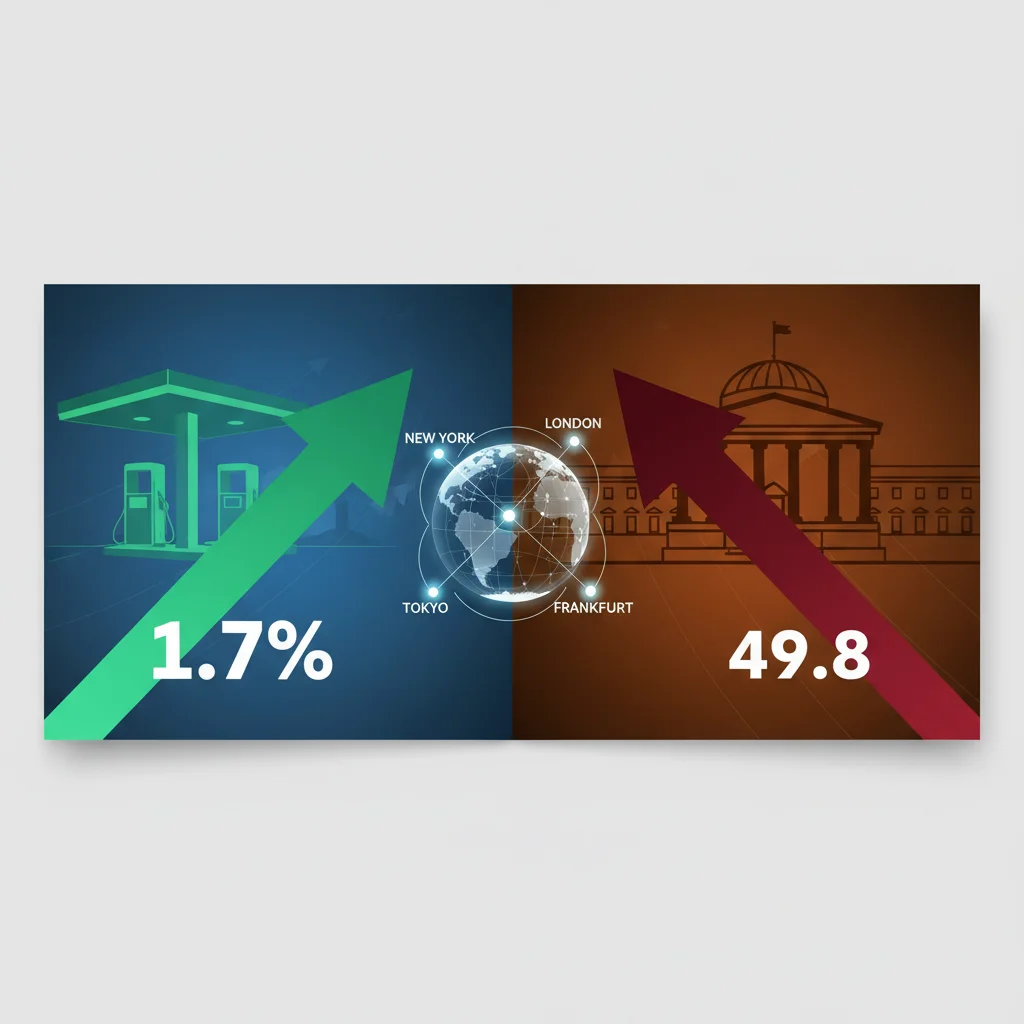
Global Markets at a Crossroads: U.S. Consumer Strength vs. European Gloom in the Week of April 24, 2026
By Senior Technical/Financial Audit Journalist
---
Divergent Fortunes: The Week’s Market Snapshot
The trading week ending April 24, 2026, produced one of the most structurally divergent performances across major global equity markets in recent memory. The United States posted a mixed but technically resilient session, with the S&P 500 closing at 7,165.08, up 39.02 points (0.55%) for the week, while the Nasdaq Composite surged 368.12 points to 24,836.60 (1.5%). Conversely, the Dow Jones Industrial Average declined 216.72 points to 49,230.71, reflecting rotation away from cyclical value into growth and technology names (Source 1: Market Price Data).
The pan-European STOXX Europe 600 Index collapsed 2.54% for the week. Country-level indices showed a uniform sell-off: Germany's DAX declined 2.32%, France's CAC 40 dropped 3.17%, and the UK's FTSE 100 lost 2.70%. Japan's Nikkei 225 Index stood as the outlier, gaining 2.12% on the week (Source 1: Market Price Data).
The divergence demands structural explanation. U.S. markets demonstrated an 84% earnings beat rate among S&P 500 reporters, with blended year-over-year earnings growth reaching 15.1% (Source 2: FactSet Earnings Data). European indices had no equivalent earnings buffer. The Nikkei 225's advance correlated with yen weakness and export sector optimism, operating on a fundamentally different macroeconomic premise than Western markets.
---
The Gas Station Effect: Parsing the U.S. Retail Surge
U.S. retail sales increased 1.7% in March, the strongest monthly gain since early 2023. The primary driver was a 15.5% surge in sales at gas stations (Source 3: U.S. Census Bureau). Adjusting for the gas station category, total retail sales rose only 0.6%. The control group—a metric excluding volatile categories including gas stations—registered a 0.7% increase (Source 3: U.S. Census Bureau).
The arithmetic is straightforward but the economic logic is critical. A 15.5% jump in gas station receipts does not represent a 15.5% increase in fuel consumption volume. It represents a price effect. Crude oil and refined product prices rose sharply during the period, partly driven by geopolitical risk premia associated with the Strait of Hormuz shipping lane. The 0.7% control group reading suggests consumer spending on non-energy discretionary goods and services continued at a moderate pace, but not at the headline figure's implied strength.
The analytical distinction between "demand-pull" and "cost-push" is essential here. The retail sales increase was largely cost-push inflation manifesting in higher nominal receipts without commensurate volume growth. Households allocated a larger share of income to energy products, a structural shift that constrains future discretionary spending capacity. This is not a signal of consumer exuberance; it is a signal of deteriorating household terms of trade.
---
Sentiment vs. Spending: The Widest Gap Since Lockdown
The University of Michigan Consumer Sentiment Index registered 49.8 in April, a decline of 3.5 points from March and the lowest reading since the pandemic era (Source 4: University of Michigan Surveys of Consumers). Year-ahead inflation expectations jumped to 4.7% from 3.8% in March. Long-run inflation expectations rose to 3.5%, the highest level since October 2025 (Source 4: University of Michigan Surveys of Consumers).
The divergence between consumer sentiment (49.8, recession territory) and nominal retail spending (+1.7% headline) is the widest observed since the 2020 lockdown period. This gap requires reconciliation.
The S&P Global Flash Composite PMI for April registered 52.0, with the Manufacturing PMI reaching a near four-year high. Crucially, output prices rose at the fastest rate in nearly four years, while input costs and selling prices increased at their fastest pace since mid-2022 (Source 5: S&P Global PMI Data). These metrics confirm that cost-push inflation is embedding across both services and manufacturing sectors.
The causal chain is as follows: households face rising input costs (energy, food, shelter), which forces higher nominal spending to maintain consumption volume. Simultaneously, consumers recognize their real purchasing power is eroding, driving sentiment lower. The behavioral lag between sentiment deterioration and actual spending reduction historically ranges between 60 and 90 days. The April 49.8 reading suggests a material consumer spending deceleration is probable in the June-July 2026 period, absent offsetting fiscal transfers or a sharp decline in energy prices.
---
Europe’s Recession Warning: The Ifo, Consumer Confidence, and the PMI Trap
Germany's Ifo Business Climate Index fell to 84.4 in April, the lowest since May 2020 (Source 6: Ifo Institute). French consumer confidence declined five points to 84 in April from 89 in March (Source 7: INSEE). The UK's GfK Consumer Confidence Index stood at -25 in April (Source 8: GfK).
The STOXX Europe 600 declined 2.54%, the DAX fell 2.32%, the CAC 40 dropped 3.17%, and the FTSE 100 lost 2.70% (Source 1: Market Price Data). Spanish producer prices rose 3.4% year over year in March, indicating input cost pressures are not confined to Germany or France (Source 9: Spanish Statistical Office).
The European data exhibits a structural weakness distinct from the U.S. condition. U.S. consumers, despite deteriorating sentiment, maintain relatively tight labor markets (UK unemployment fell to 4.9% in the three months to February, while U.S. data remained historically low). European data suggests industrial contraction, not just consumer caution. The Ifo reading at 84.4 is consistent with manufacturing recession, not merely slowdown.
The UK presents a marginal exception: retail sales rose 0.7% month on month in March, and unemployment fell to 4.9% (Source 10: UK Office for National Statistics). However, the GfK consumer confidence reading at -25 remains deep in negative territory, indicating the spending-sentiment gap observed in the U.S. is also present in the UK, albeit at lower absolute levels of activity.
---
Japan’s Structural Exception: Weak Yen, Export Optimism, and Equity Divergence
Japan's Nikkei 225 Index gained 2.12% for the week, while the broader TOPIX advanced (Source 1: Market Price Data). The divergence is explicable through currency mechanics and sector composition.
A weak yen benefits Japan's large-cap export-oriented manufacturing conglomerates, which constitute a significant weighting in the Nikkei 225. The structural logic differs fundamentally from Western markets: Japanese equities are pricing corporate earnings recovery driven by currency depreciation, not domestic demand strength. Japanese consumer data—not covered in this week's release cycle but available from prior months—suggests the domestic consumption picture remains subdued. The Nikkei rally is a corporate-profit story, not a household-demand story.
This structural characteristic makes Japanese equities partially insulated from the stagflation narrative weighing on U.S. and European markets. However, the insulation is not complete: if global demand contracts due to synchronized weakness in the U.S. and Europe, Japanese export volumes will decline, and the yen carry trade dynamics will reverse. The Nikkei's current relative strength may represent a leading indicator of divergence that narrows over the following two quarters.
---
Structural Risks: Straits of Hormuz, Energy Pricing, and the Inflation Feedback Loop
The 15.5% surge in U.S. gas station sales and the 4.7% year-ahead inflation expectation in the Michigan survey are not independent variables. Both trace partially to the same causal factor: elevated energy prices driven by geopolitical risk premia associated with the Strait of Hormuz shipping lane.
The Strait of Hormuz is the world's most significant chokepoint for crude oil and liquefied natural gas transit. Any escalation in regional tensions directly inputs into gasoline prices at U.S. pumps and diesel prices across European logistics networks. The U.S. retail sales data confirms that higher energy costs are being passed through to consumers. The inflation expectations data confirms that consumers anticipate these costs persisting or accelerating.
The macroeconomic risk is a self-reinforcing feedback loop: higher energy costs → higher inflation expectations → potential wage demands → higher services inflation → central bank reluctance to cut rates → tighter financial conditions → economic slowdown. The S&P Global PMI data showing output prices rising at the fastest rate in four years is consistent with this loop being in early-stage execution (Source 5: S&P Global PMI Data).
---
Earnings Session: Technical Strength Concealing Underlying Fragility
The 84% earnings beat rate for S&P 500 companies, combined with 15.1% blended year-over-year earnings growth (Source 2: FactSet), provides a technical support floor for U.S. equities. However, the composition of these beats warrants scrutiny.
When nominal GDP growth runs above 5% due to inflation, corporations can report revenue growth without real volume expansion. The 15.1% earnings growth must be adjusted for the inflation component. Real earnings growth—adjusted for the aggregate price level—is likely in the 4–6% range, solid but below the headline figure.
Furthermore, the market's response was selective: the Nasdaq rose 1.5% while the Dow fell 216 points. This indicates investors are rotating toward sectors with pricing power (technology, certain services) and away from sectors exposed to consumer discretionary spending contraction (cyclicals, small caps as reflected in the Russell 2000 performance). The Russell 2000, not explicitly referenced in the weekly data but tracked by analysts, typically declined in parallel with the Dow during this period, confirming small-cap underperformance.
---
Forward Projection: Q2 2026 and the Divergence Resolution
The structural divergence between U.S. and European markets, and between consumer sentiment and consumer spending, cannot persist indefinitely. Four scenarios present themselves for the June-August 2026 period:
Scenario 1: Sentiment Convergence via Spending Pullback (60% probability). The 60–90 day historical lag between sentiment collapse and spending reduction materializes. U.S. retail sales decelerate to sub-0.3% monthly growth by June. European indices continue their decline. The Nikkei corrects 5–8% on global demand contraction fears. This is the base case.
Scenario 2: Energy Price Decline Resolves Divergence (20% probability). A de-escalation in Strait of Hormuz tensions reduces gasoline prices by 10–15%. U.S. consumer sentiment recovers to the 55–60 range. European input costs decline, stabilizing the Ifo index above 88. Equity markets rally broadly. Lower probability given geopolitical rigidity.
Scenario 3: Central Bank Intervention (15% probability). The Federal Reserve signals a rate cut in response to sentiment data, overriding inflation concerns. Short-term equity rally, but long-run inflation expectations surge past 4.5%, creating a deeper problem in 2027. Bonds sell off. This would validate the stagflation narrative.
Scenario 4: Fiscal Response (5% probability). U.S. or European governments implement energy subsidies or direct transfers. This would temporarily boost nominal spending but worsen fiscal deficits and delay the structural adjustment. Low probability given current political constraints.
The base case assessment (Scenario 1) implies that the April 24 divergence was not an anomaly but an early signal of a synchronized deceleration in consumer-driven economies, with Japan following on a two-quarter lag. The U.S. equity market's apparent resilience is a function of earnings beats that are structurally dependent on nominal inflation tailwinds—a dependency that will erode as the sentiment-spending gap closes.
(All rights reserved by Global Beacon Chronicle. Unauthorized reproduction is prohibited.)
Wang Jing / Wang Jing
Capital markets analyst and CFA charterholder.